
The best way to use SALTT is to leave it running on your desktop and tinker with it every so often. It can handle low-level task management and a to-do list, but it is really meant for bigger picture stuff around values and aims, dreams, quests; or at least getting your life in order to some extent.
You tell the computer what to do; don’t let the computer tell you! The reliance some people put on technology is horrifying. SALTT is intended as decision support; to help you to sort out, and make up your own mind. Use it in a way that it doesn’t dictate.
Note: the MVP test releases are likely to have bugs, so don’t rely on it too much.
Let it help you to think things through while you are away from the computer; these things tend to occur at the oddest of times: while you are brewing up, raiding the fridge, brushing your teeth. Put it into SALTT at some convenient time. Just check in with SALTT now and then like you would do with emails. It will prompt you on what you want to concentrate on, and guide you away from distractions. A good time to update SALTT is at the beginning and end of your day.
SALTT invites you onto a journey of recovery, and then further onto a voyage of personal excellence.
Some of the terminology may seem a bit cumbersome at the moment. This is because it is drawn from the class names in the underlying code, but is subject to change to more user friendly terms.
Core functionality and controlling SALTT
The key aspects of SALTT are:
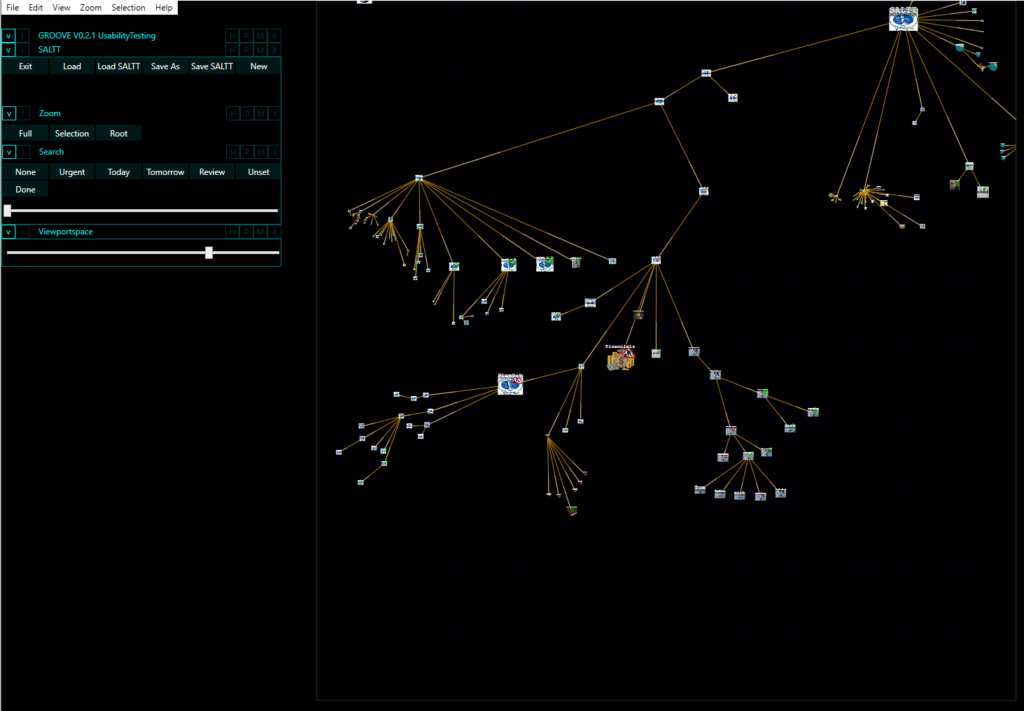
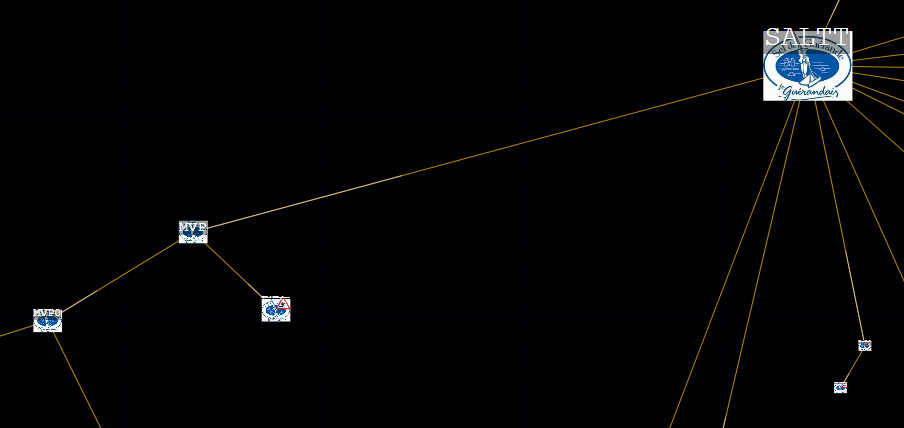
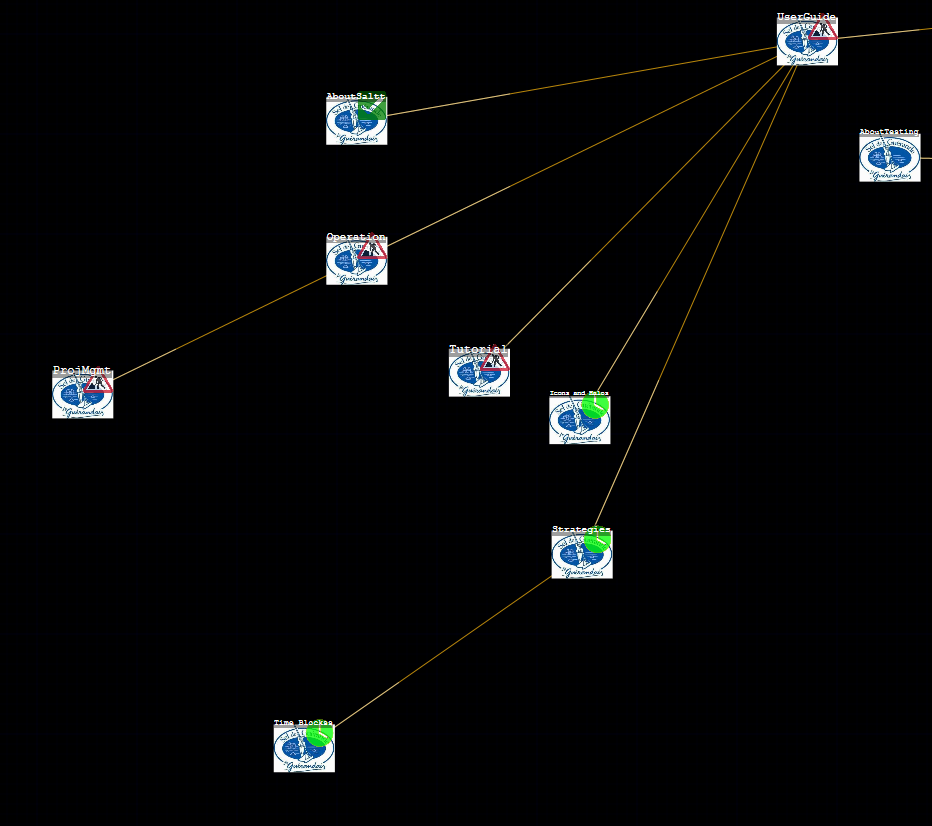
- The appearance of the graph and visualisation of structure and data: the structure of a user’s life topics and how they fit together. This is cognitively easy to understand, remember and manipulate in the mind’s eye. It gives a visual impression of the load of each area and so gives an indication of balance and well-roundedness. With this structure in mind, it becomes possible to recognise what to focus on and where the user’s energies would be well employed.
- Navigating around the graph and zooming in: in the overview, the images and labels of the topics can become too small to actually see. This actually becomes an advantage in the big picture as the user who sets up the structure comes to understand what is going on simply from the shape of the tree. However, it is also useful to zoom in to more detail in areas and view the images and read the labels and move around the graph
- Searching and displaying of results: nodes and edges in a graph database have properties. In SALTT certain properties relate to the status of a topic: scheduling, levels of completeness, delays and so on. One of the powers of SALTT is to be able to search by various criteria on components and to illustrate the results with animated graphics. This feature enables the eye to be drawn to the areas the user wishes to focus on, immediately see what their priorities are, and check their progress.
- Selection and editing of graph components: moving things around and changing data.
The interface has been designed to operate like a graphics package: Corel, Gimp etc. and shares the many similar hot-keys and drag and drop functionality, but made specific to SALTT’s purposes. By default the root node has a pulsating golden halo.

The cards in the inspector panel automatically change depending on which graph object is selected. If things get cluttered then to make it more readable then the Collapse and Expand boxes can be used.
Save and Load
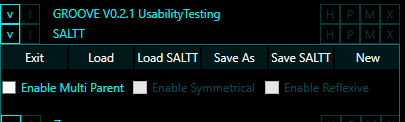
GROOVE is the underlying graph engine SALTT was developed in. The SALTT panel allows for Saving, Loading, New graphs, and Exiting the application.
Note: The Enable Multi Parent check box is for advanced use where the graph is not a tree. Enabling this may result in errors; avoid checking it.
Navigation and Zooming
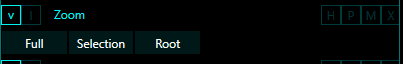
- Mouse wheel with no modifiers over the graph canvas – zooms in or out from the mouse pointer.
- LMB (left mouse button) on the canvas’ background while dragging moves the graph around.
- From the Zoom panel
- Full – shows the full graph
- Selection – if a node is selected, then the graph will zoom in onto its subtree.
- Root – the root node is zoomed onto
- The Viewportspace panel enables the resizing of the graph pane
Search
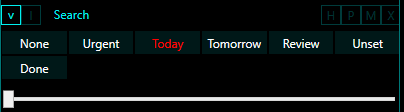
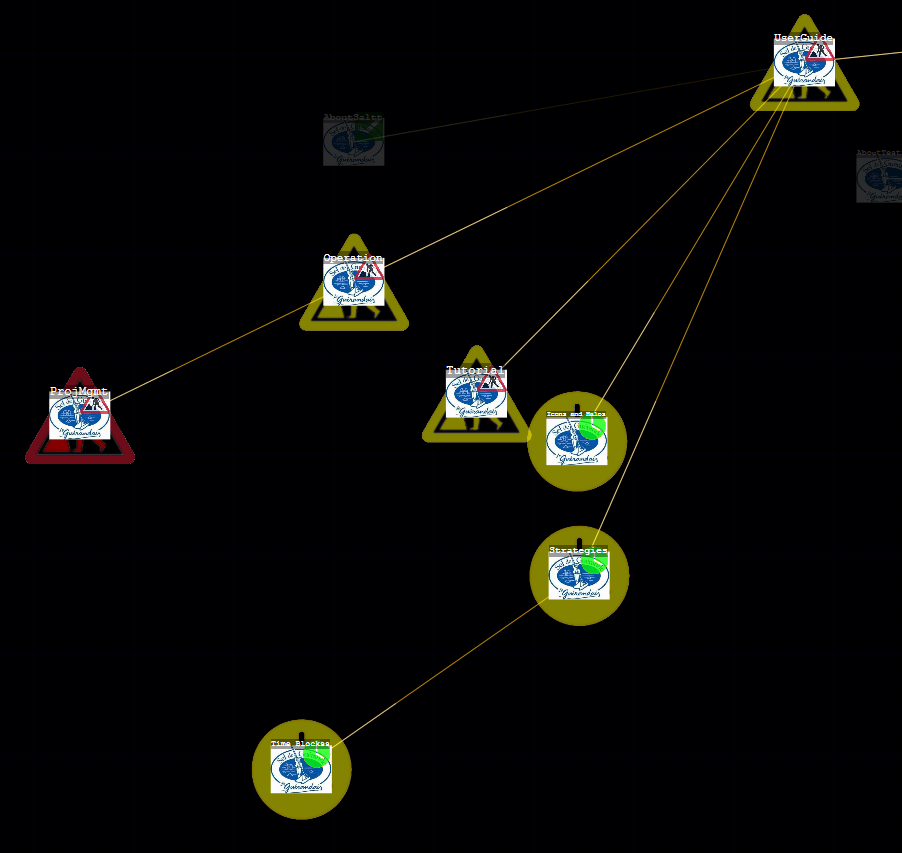
The search panel has a number of standard searches which adjust the appearance of various graph components according to the search. [Nb. there is a bug which clips the highlight icons; this can be worked around by zooming]
- None clears the search
- Urgent urgent and late items, and those that need setting
- Today items scheduled for today, items to catch up on, items completed today
- Tomorrow a view of what is on for tomorrow
- Review things that can wait, but require another look at
- Unset items unset that are not marked to be set
- Done all completed tasks
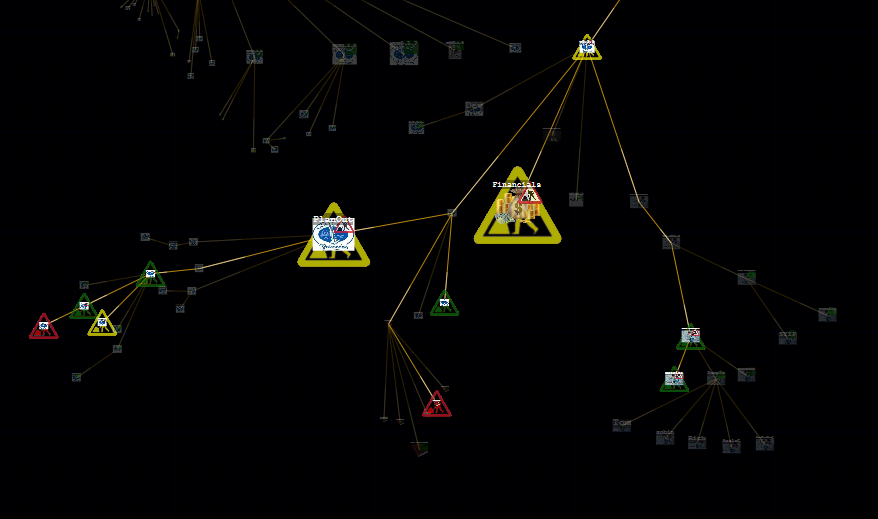
In general, search results are coloured:
- Red: late
- Amber: late but catching up
- Yellow: in the scheduled window
- Green: scheduled for some future time
The Lighning bolts show the paths upto the root node. The slider bar in the search panel sets the contrast so that the results can be seen easier.
Graph component selection
Click on component node to select; it will have a pink halo to show it is the primary selected graph component.

Secondary selected graph components (eg. in a selected subtree) will have lime-green halos. The inspector panel (described later) will also reflect information about the primary selected item.

Alternatively context menus are provided:
Nodes:
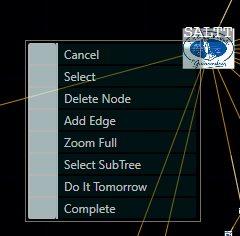
- Cancel deselects all selections (but not searches)
- Select selects primary node with pink halo
- Delete Node deletes node and adjoining edges
- Add Edge changes to pen cursor, allows node addition to background
- Zoom Full shows the whole graph
- Select Subtree selects primary and secondary nodes (lime-green halos)
- Do It Tomorrow rolls over the item’s schedule for tomorrow
- Complete marks the task complete
Edges

- Cancel deselects all selections (but not searches)
- [TBA Select] note edges are not currently selectable or editable
- Delete Edge deletes the edge
- Zoom Full shows the whole graph
Background

Click on background deselects all selections (but not searches)
- Cancel deselects all selections (but not searches)
- Add Node changes to pen cursor, allows node addition to background
- Zoom Full shows the whole graph
Editing the graph topography
Moving a set of nodes: click and drag the primary selected visual node – all selected nodes will move and the edges will continue to connect them accordingly
Resizing nodes is performed via the inspector panel.
Adding nodes and edges: context menu of the background (Add Node) or the context menu of a node (Add Edge). The mouse pointer changes to a pen indicating that nodes can be added on clicking. This can be cancelled from the context menu (Cancel) which will return to selection mode. Add Node adds individual nodes to the background without adjoining edge.
Add Edge, puts a blue halo around the “From” node and clicking on the background will add both a node and an edge between the From node and the new Upto node; the node’s icon and label will be duplicated.
An edge can be added between existing nodes similarly by selecting Add Edge in the context menu on the From node then clicking an upto node. As the graph is constrained to be a tree, then any current edge leading to the upto node will be deleted.
Deleting individual graph components can be done in the context menu. Deleting a set of graph components: DEL – deletes all selected visual graph components
Manipulating sub-trees
Trees are a very important graph data structure and are used extensively in SALTT so their manipulation is given special attention. A subtree is a tree that can have further subtrees. Every tree has a root node: the whole graph has a global root node (golden halo) and any subtree will have a local root node. A subtree in SALTT is a selection: a set of nodes and a set of edges. In a subtree, the root node is the primary selected visual node with a pink halo, the other secondary selected visual components have lime-green halos.
A subtree is selected on the chosen root node’s context menu (Select Subtree)
Move: LMB drag on subtree’s root node with a subtree selected
Resize: A whole selected subtree can be resized from the inspector panel (changing image only affects the root node).
Rotate: Alt+MouseWheel with a subtree selected
Editing visual graph components in the Inspector panel.
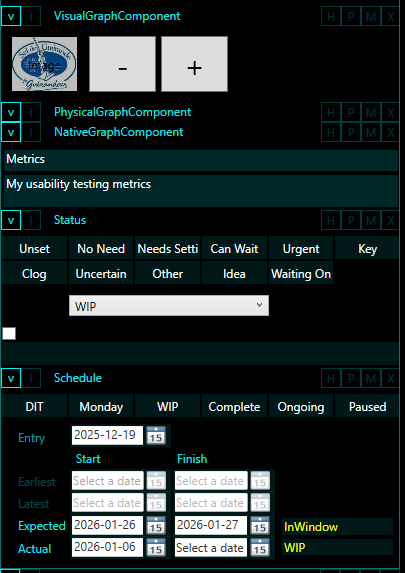
The inspector panel shows the object properties for the primary selected visual graph component (NB. by default in the underlying code, contains a physical graph component and a native graph component. A native graph component has a status and a schedule. While the underlying class hierarchy is not important to the user, they are preserved in the inspector’s structure.) The Status and Schedule components are covered in a separate section.
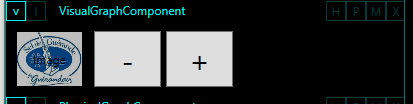
Changing node’s topic icon: clicking the image button brings up a dialog where an image can be selected. New images can be moved into the folder as usual.
Node size is adjusted using the Plus and Minus buttons
[Note: edges are not currently selectable or editable]
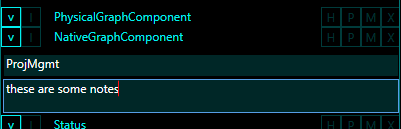
In the panel (currently called NativeGraphComponent) are a couple of text boxes: the top one is the node/topic name that will appear on the node in the graph; the lower one provides some space for notes.
Statuses & Schedules
The Status refers to the progress of a topic (whether scheduled, work in progress, completed etc.) while the Schedule is about when an activity is to be or has been started or finished (for the future, work in progress, or late etc.) These two concerns are interrelated in a somewhat complex way as some statuses update schedules, while some schedules update status.
Status
The buttons in the Status panel allow it to be quickly set.
[NB. the drop down and the check-box are legacy; please ignore them]
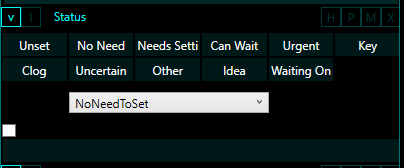
The status is reflected on the node as a Status Icon, it is also used in searches and is indicated in the search results appearances.
Schedule [Nb. Current version is not complete]
Scheduling is based on ideas from project management showing dates that can be assigned to expected and actual start and finishes of a topic, along with its punctuality and activity (which combine to provide the topics status).
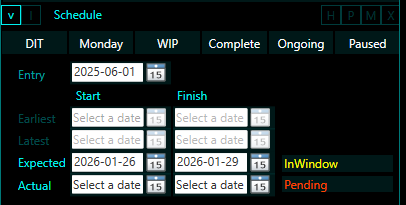
Entry
The four important date pickers are abbreviated to
- DSX: Date Start Expected
- DFX: Date Finish Expected
- DSA: Date Start Actual
- DFA: Date Finish Actual
Punctuality
- Early: task has not been scheduled to start yet
- Late: task scheduled to have finished by now
- InWindow: today is between DSX and DFX
- InRecovery: task is late but being caught up
- Undefined: other punctuality
Activity
- UnSet: activity status is not set
- Done: complete or abandoned
- Ongoing: an ongoing process
- Pending: remains to be started
- Pause: started but activity suspended
- WIP: currently work in progress
- Active: otherwise active
Quick set buttons
- DIT – Do It Tomorrow – sets the DSX to tomorrow’s date
- Monday – sets the DSX to next monday’s date
- WIP – Work In Progress – sets DSA to today’s date
- Complete – sets DFA to today’s date
- Ongoing – resets DSX, DFX and DFA
- Paused – resets DFX and DFA