For Windows 10 or above.
Download SALTT V0.2.x with file structure
This link to some Google Drive space opens my SALTTDownloadArea folder. Download the SALTT folder – google should zip it to Downloads on you machine.
This MVP must be on the C drive owing to a limitation in the underlying XML file. This will require unzipping.
Unzip it to C:\.
You might need to go through some security checks and download a .net thing. If you are OK with all that then Launch (you can make a desktop short cut if you want):
C:\SALTT\net10.0-windows\MendelApplication.exe
There is a Loadable example file in the tutorial to look at:
C:\SALTT\ProjectDemo.xml
On launch, SALTT will load its default user data: MySALTT.xml and display the graph. This is likely to be blank, but you can Load ProjectDemo.xml to see an example graph.
Other user data can be loaded or saved using the object inspector column SALTT; either from the default file or some other file.
Quit and the [X] heading box close the programme without saving.
The object inspector is adaptive to selected objects in the application; the header bar says what kind of object it references. These inspector items are collapsable and expandable using the
- [V] item to show more options.
- {[I], [H], [P], [M]} are reserved for future implementation.
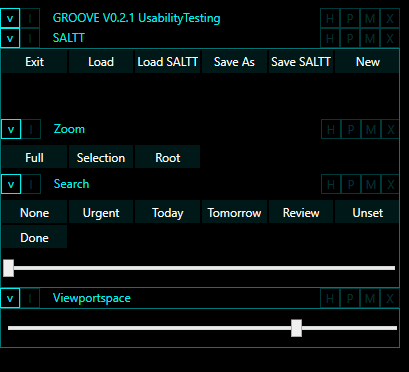
Use the Viewportspace item adjusts the size of the main graph canvas if it does not fit on your screen.
Underpinning SALTT is an object oriented graph database (called Graph Object Oriented Visual Environment: GROOVE). This uses mathematical graph theory: a set of nodes which are joined by a set of edges. The graph is represented on screen as customisable images (icon like thumbnails) and lines between them.
For the focus management and “salience alignment” application of SALTT (Salience Alignment Training Technology), the nodes represent topics and the edges represent the dependencies between topics. As focus management is a bigger picture rather than simply a task list, then the topics, represented by nodes, are intended to denote areas of focus (eg Health, Career, Travel etc.) rather than to-do items (objectives) to be ticked off when complete. However, they may also denote lower level to-do tasks where applicable.
The edges indicate the interdependencies between topics: where a more general area of focus becomes better satisfied by the satiation of more specific areas of focus (or task completion). The relationships form a tree structure, whereby the more general topics drill down to maybe several more specific ones. As a guiding idea, a topic is satisfied when its child topics are satisfied (although this is more of a matter of degree of satisfaction or completeness, and may be subjective). As a tree structure, any topic can have no more than one parent topic. The base of the tree, the root node having no parent topic, is meant to convey all the areas of life being modelled. Leaf nodes, those with no further child nodes, tend to be more task oriented, while the higher (medial) nodes become more abstract and aspirational.
The overall graph then is a map of the topics of a user’s life that will adjust over time with use. It becomes possible to visualise, through graphics and animation, what is enabling and what is clogging, what is salient and what is irrelevant, what topics are required to achieve higher level intentions, and where a sense of balance and wellbeing is not being achieved, then, importantly, what to do about it.
Upgrading
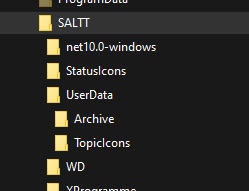
As there is no upgrade wizzard yet, then upgrades between versions will be done by replacing the folder with the programmes in it C:\SALTT\net10-windows. The other folders contain user data such as topic icons and graphs and can be preserved.